APEXMIS
Project & Production Analysis, Portfolio, Dashboards
- On Cloud
- On Premise

APEXMIS enhances project management for all industries, boosting efficiency, reducing costs, and providing greater visibility and control.
APEXMIS: Project Management Dashboards and Reports for Every Industry
APEXMIS is a powerful project management platform that provides graphical interactive analytical dashboards and reports for all functions of a project, including schedule and cost performance, risk, HSE, quality, and finance. It can be used during all phases of execution in a wide range of industries, including infrastructure, oil and gas, petrochemicals, offshore platforms, fertilizers, pipelines, and infrastructure.
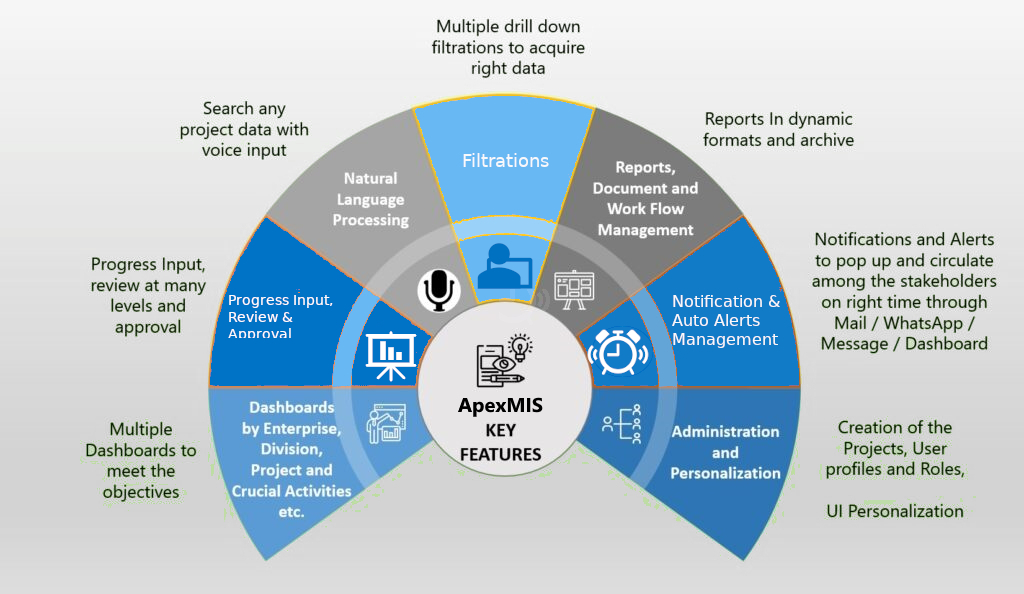
Features of APEXMIS
- User-friendly dashboards give a summary of key milestones at the unit level and for the overall project.
- MIS reporting in desired templates with respect to type of industries/sectors, geographical locations, and other criteria.
- Analysis and reporting of data in a variety of formats, including profile curves, pie charts, histograms, ring charts, and scattered charts.
- Display matrix for a project's overall progress and performance, highlighting particular problems that require further attention.
- Display of exception lists of activities for delay and lookahead for the next 90 days.
- Gives stakeholders an overview of project progress, capturing data on team performance, milestones, earned value, and efficiency.
- Allows project managers to use one dashboard display for all their active projects.
- Provides a high-level overview of completed and remaining tasks in the project, displayed as a progress chart.
- Displays a colored status bar across the top of the card indicating if the project is on track (green), at risk (yellow), or needs attention (red).
- Allows project owners to post status updates or more detailed notes about recent activities.
Benefits of APEXMIS
- Improved company performance and faster decision making achieved by using streamlined ApexMIS data visualization techniques.
- Transforms company data into real time data metrics rich visuals
- Generates the reports in the understandable formats and usable to all hierarchical levels of people
- Document centralization and accessible to download to authenticated peoples with just one click
- Project progress card as of calendar date on one click
- Progress data comparison while recording, reviewing and approving
Better data management means better decision making
- APEXMIS is a web-based software application for recording, analyzing, and reporting project progress data.
- APEXMIS can be used for projects in various sectors, including Oil and Gas, Petrochemicals, Manufacturing, and Construction.
- APEXMIS produces data in an understandable format using graphs and charts.
- APEXMIS is useful for project stakeholders to view and monitor project progress.
- Schedule and Cost performances are key controlling functions for progress measurement.
Features
- APEXMIS is an interactive dashboard software created using the latest data visualization technologies to graphically display parameters of EPC project.
- User-friendly dashboards giving a summary of key milestones at the Unit level as well as for Overall Project.
- MIS reporting in desired templates with respect to the type of industries/sectors, geographical locations, setting criteria like projects ahead of schedules, delayed projects, projects within estimated budget, projects with a cost overrun, etc.
- Analysis and reporting of data in the form of Profile Curve, Pie-Charts, Histograms, Ring Charts, Scattered Charts and so on.
- The display matrix for a project’s overall project progress and performance, highlight particular problems that require further attention. Display Exception Lists of Activities for delay and look ahead for the next 90 days.
- Provide stakeholders with an overview of a project's progress, capturing data about team performance, milestone achievements, earn value & efficiency, wherever applicable.
- As progress is made on flagged items, it will allow project managers to use one dashboard display for all their active projects.
- A high-level overview of completed and remaining tasks in the project displayed as a progress chart.
- A colored status bar across the top of the card indicating if the project is on track (green), at-risk (yellow) or needs attention (red).
- Status updates or more detailed notes about recent activities, posted by the project owner.
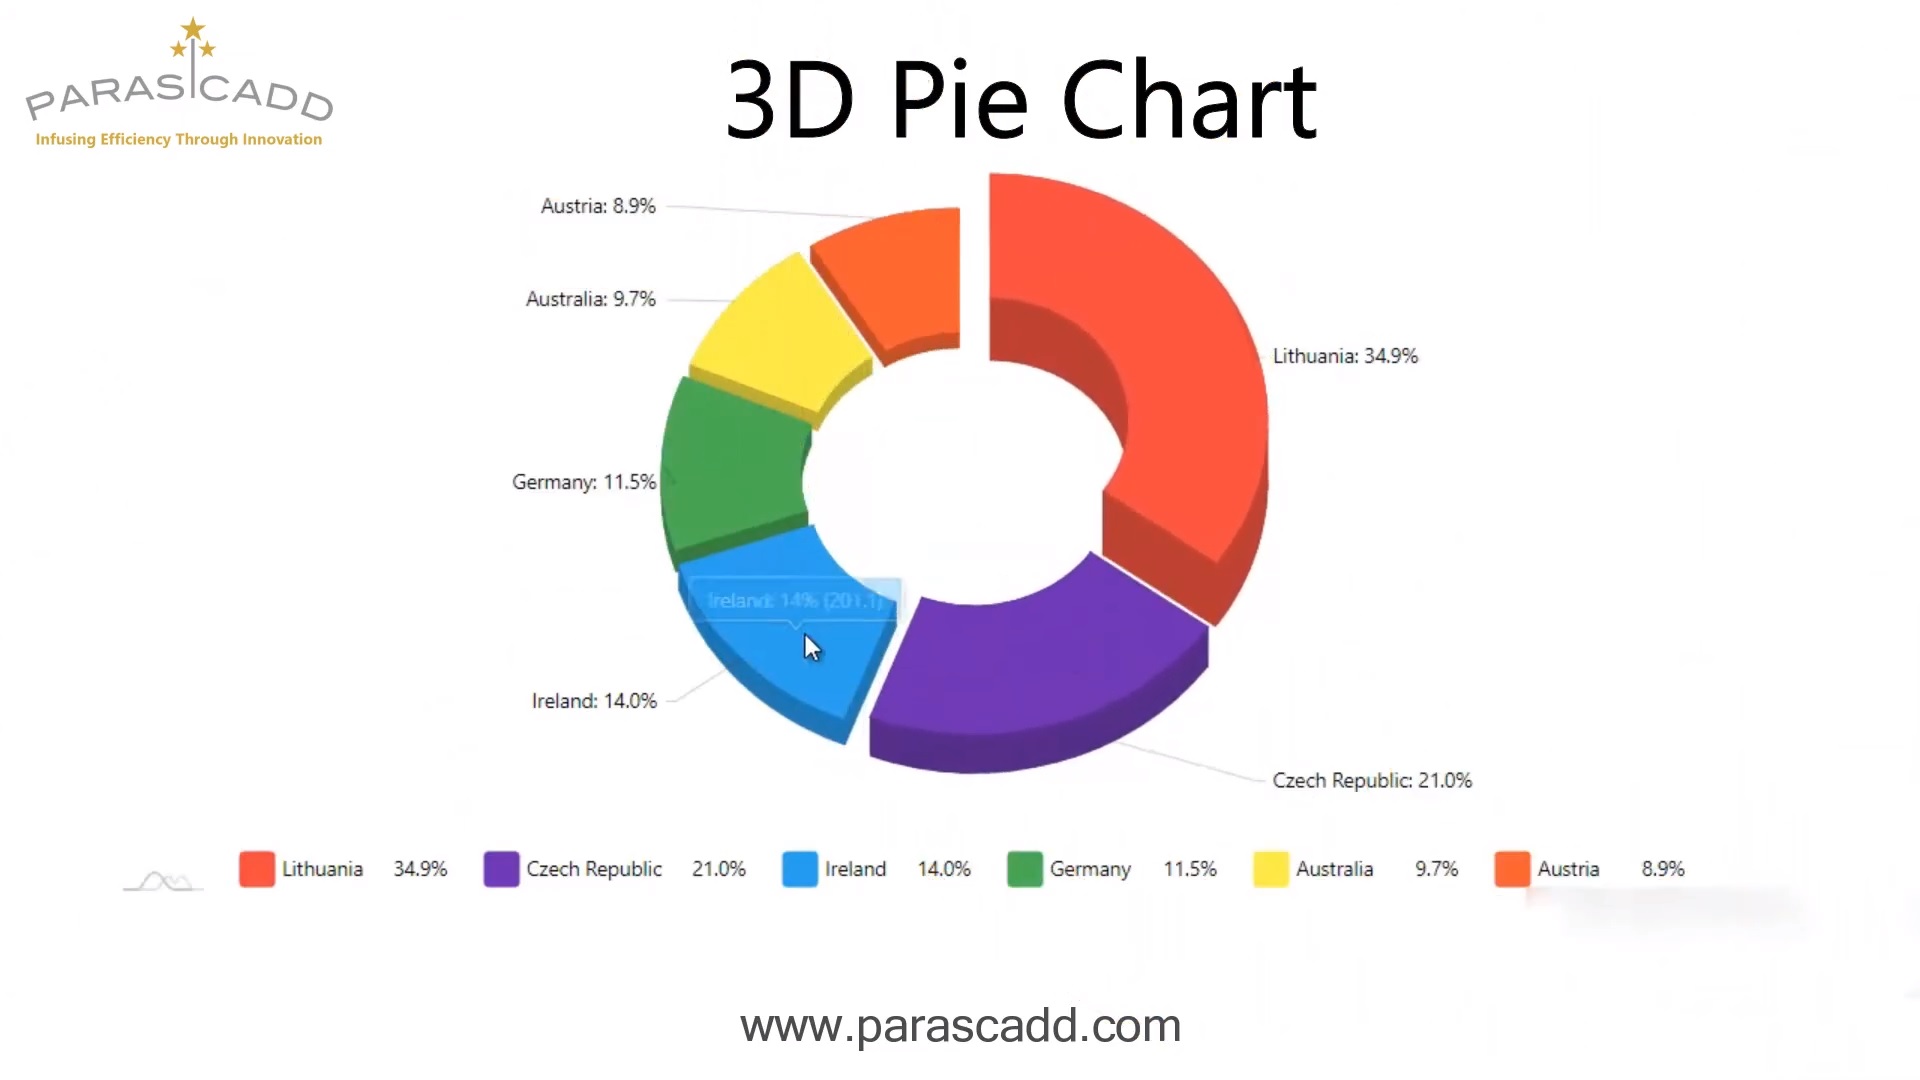
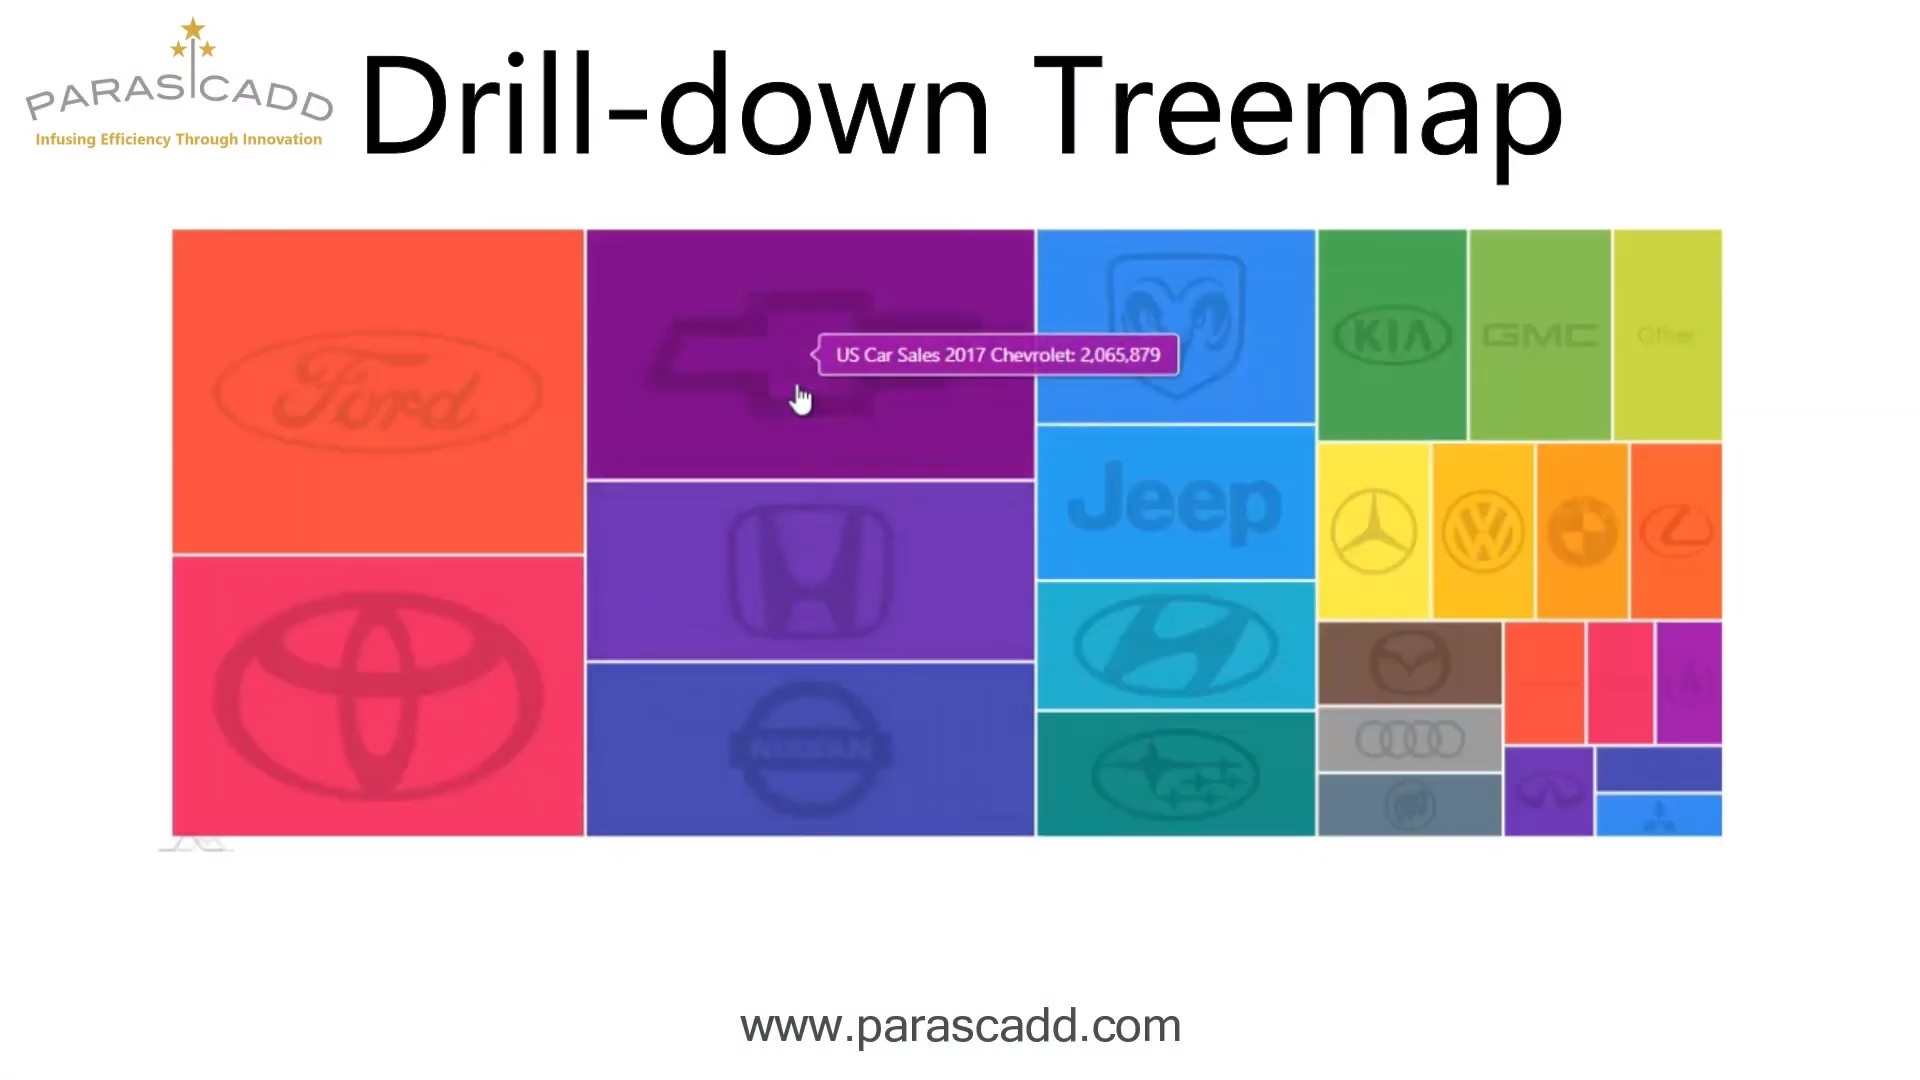
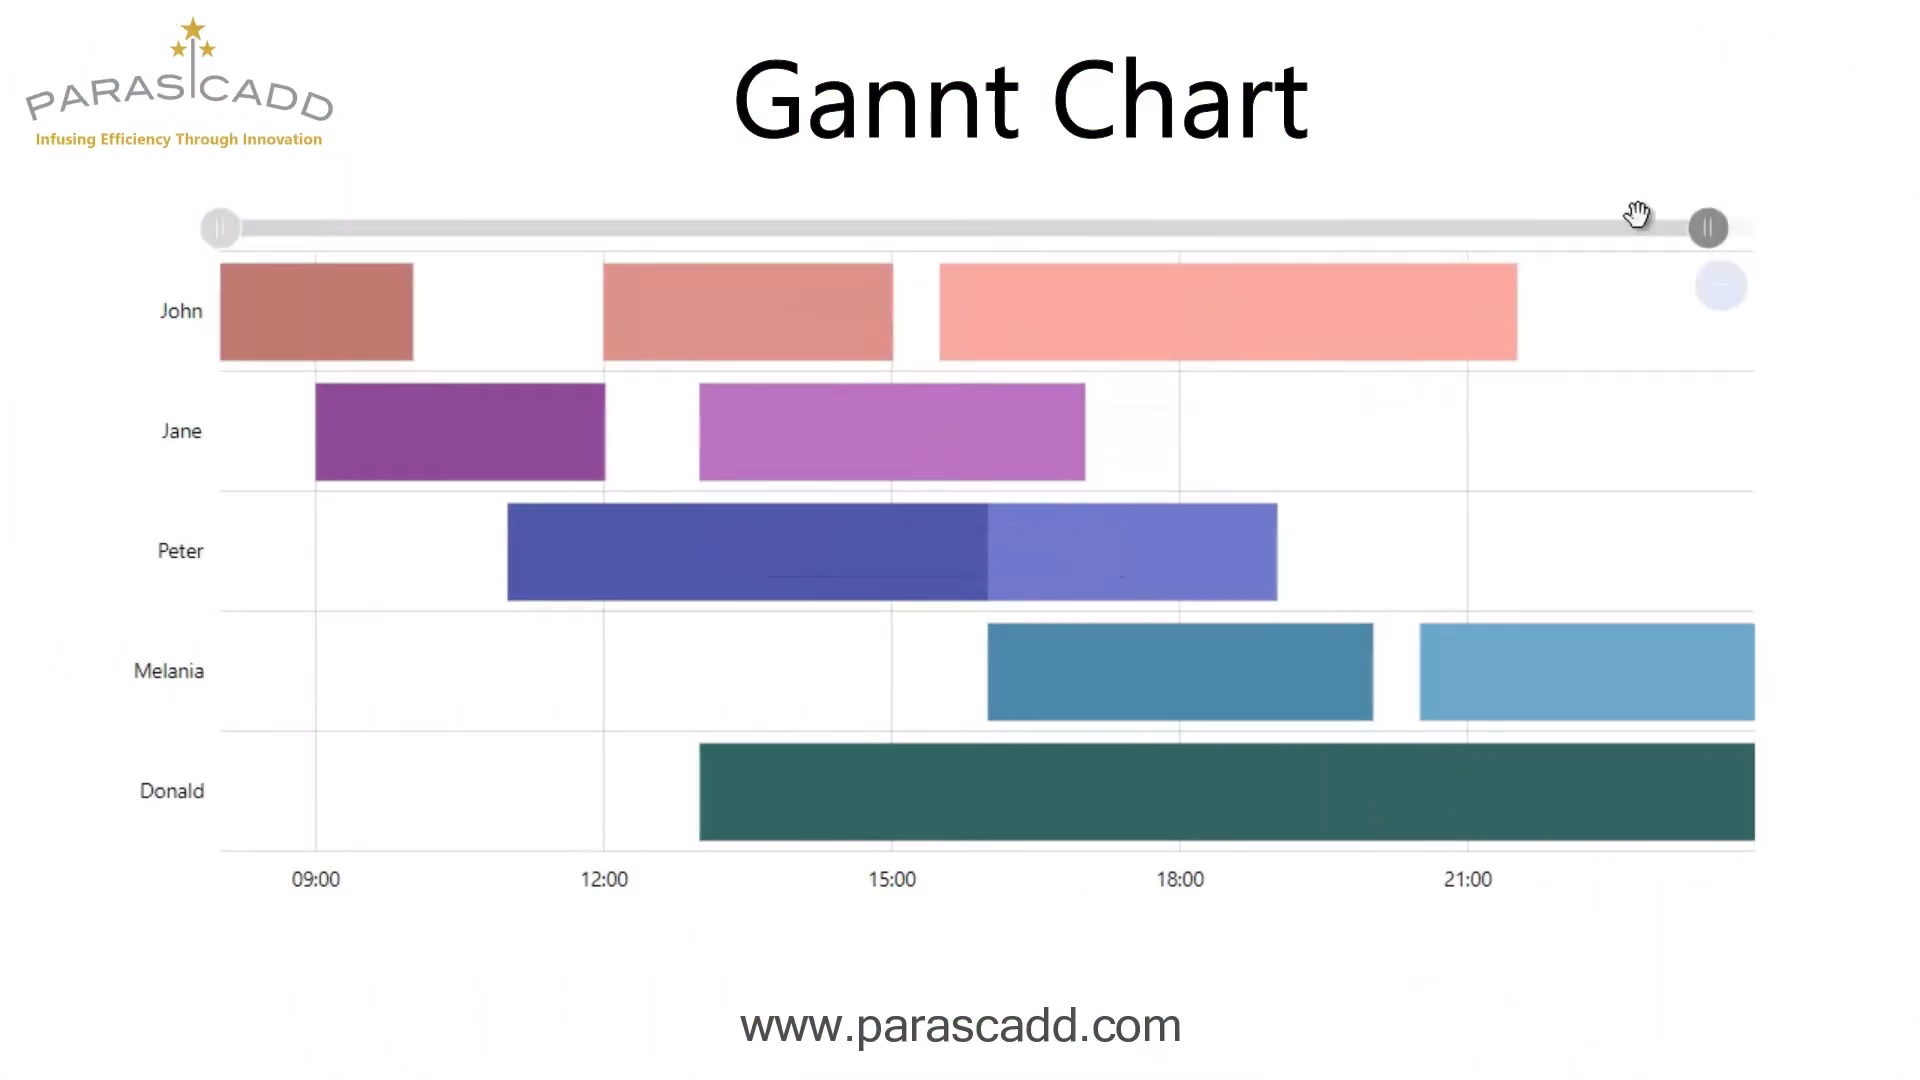
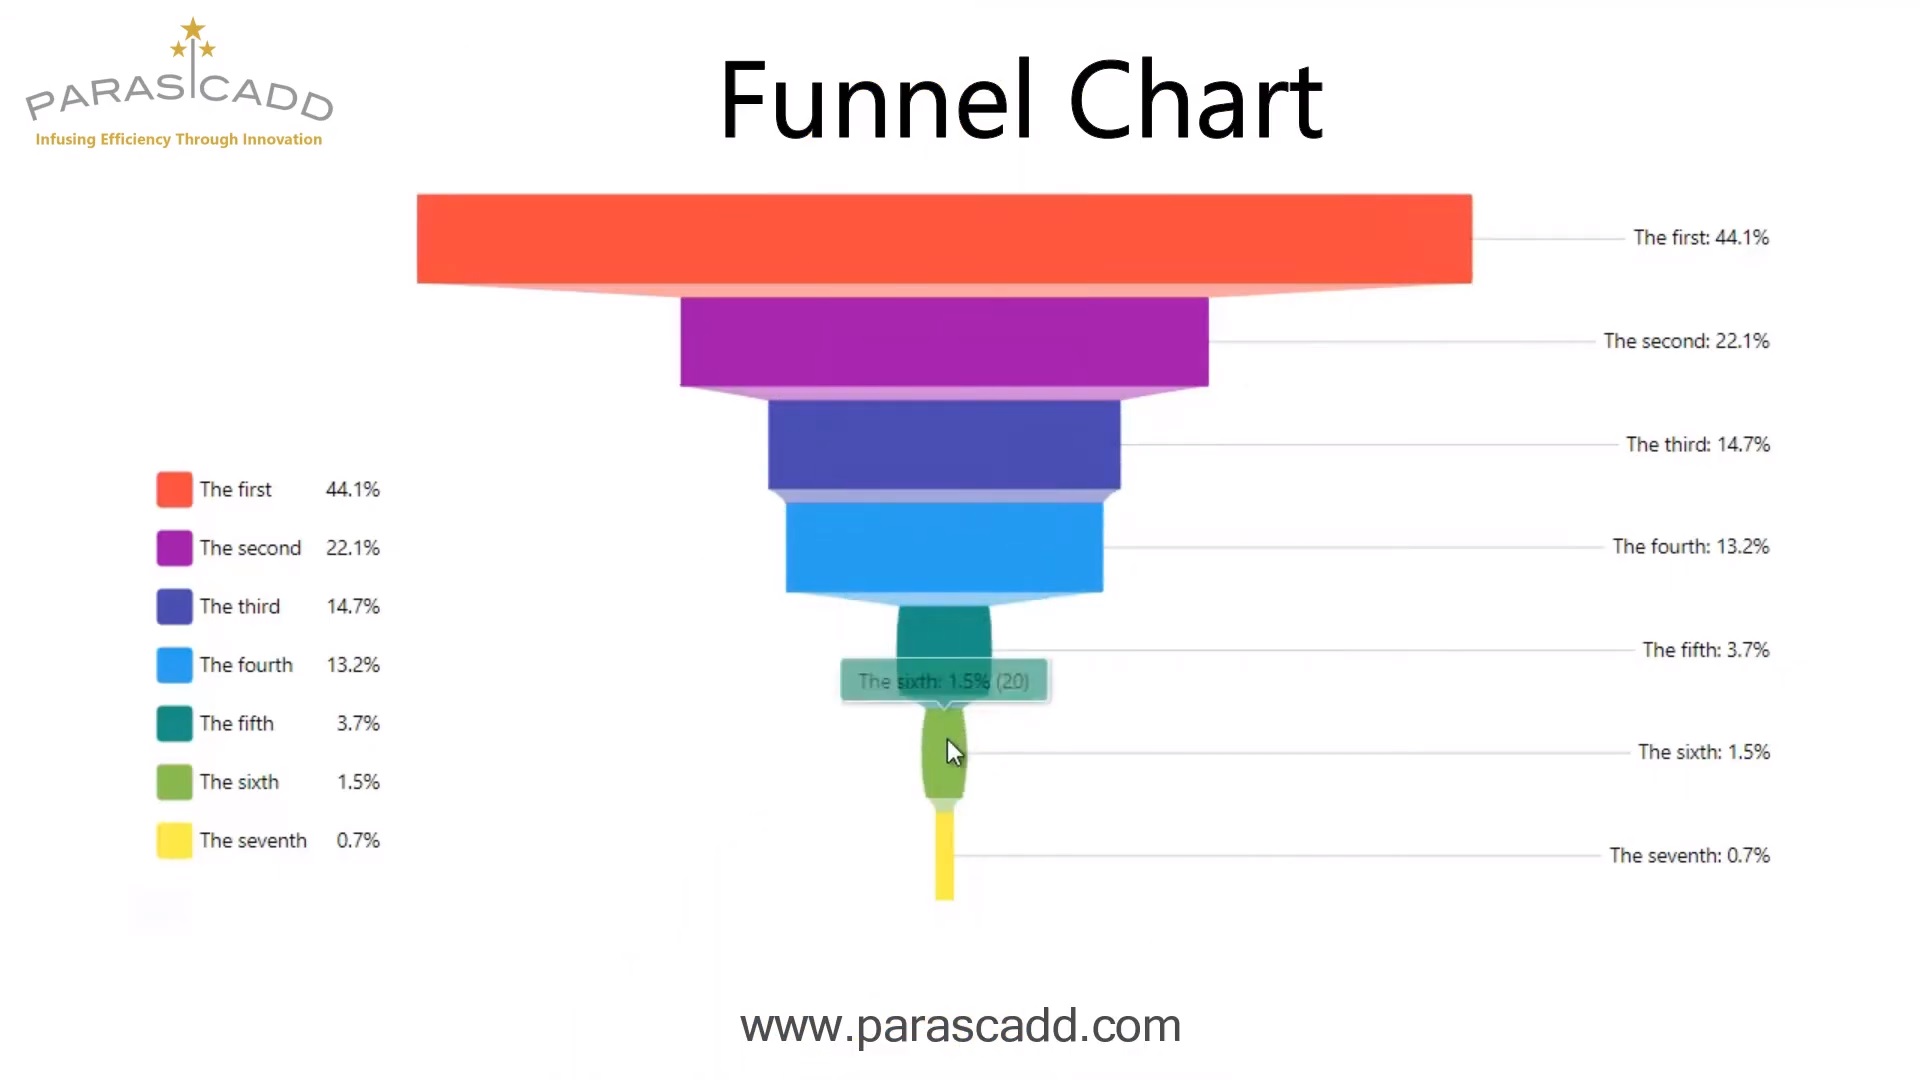

APEXMIS Chart Types
APEXMIS can be used for MIS reporting to aid top level management with Project Physical Progress, Financial Progress, Cost Overruns, Schedule Overruns, Cost Variances, Schedule Variances and other monitoring parameters.
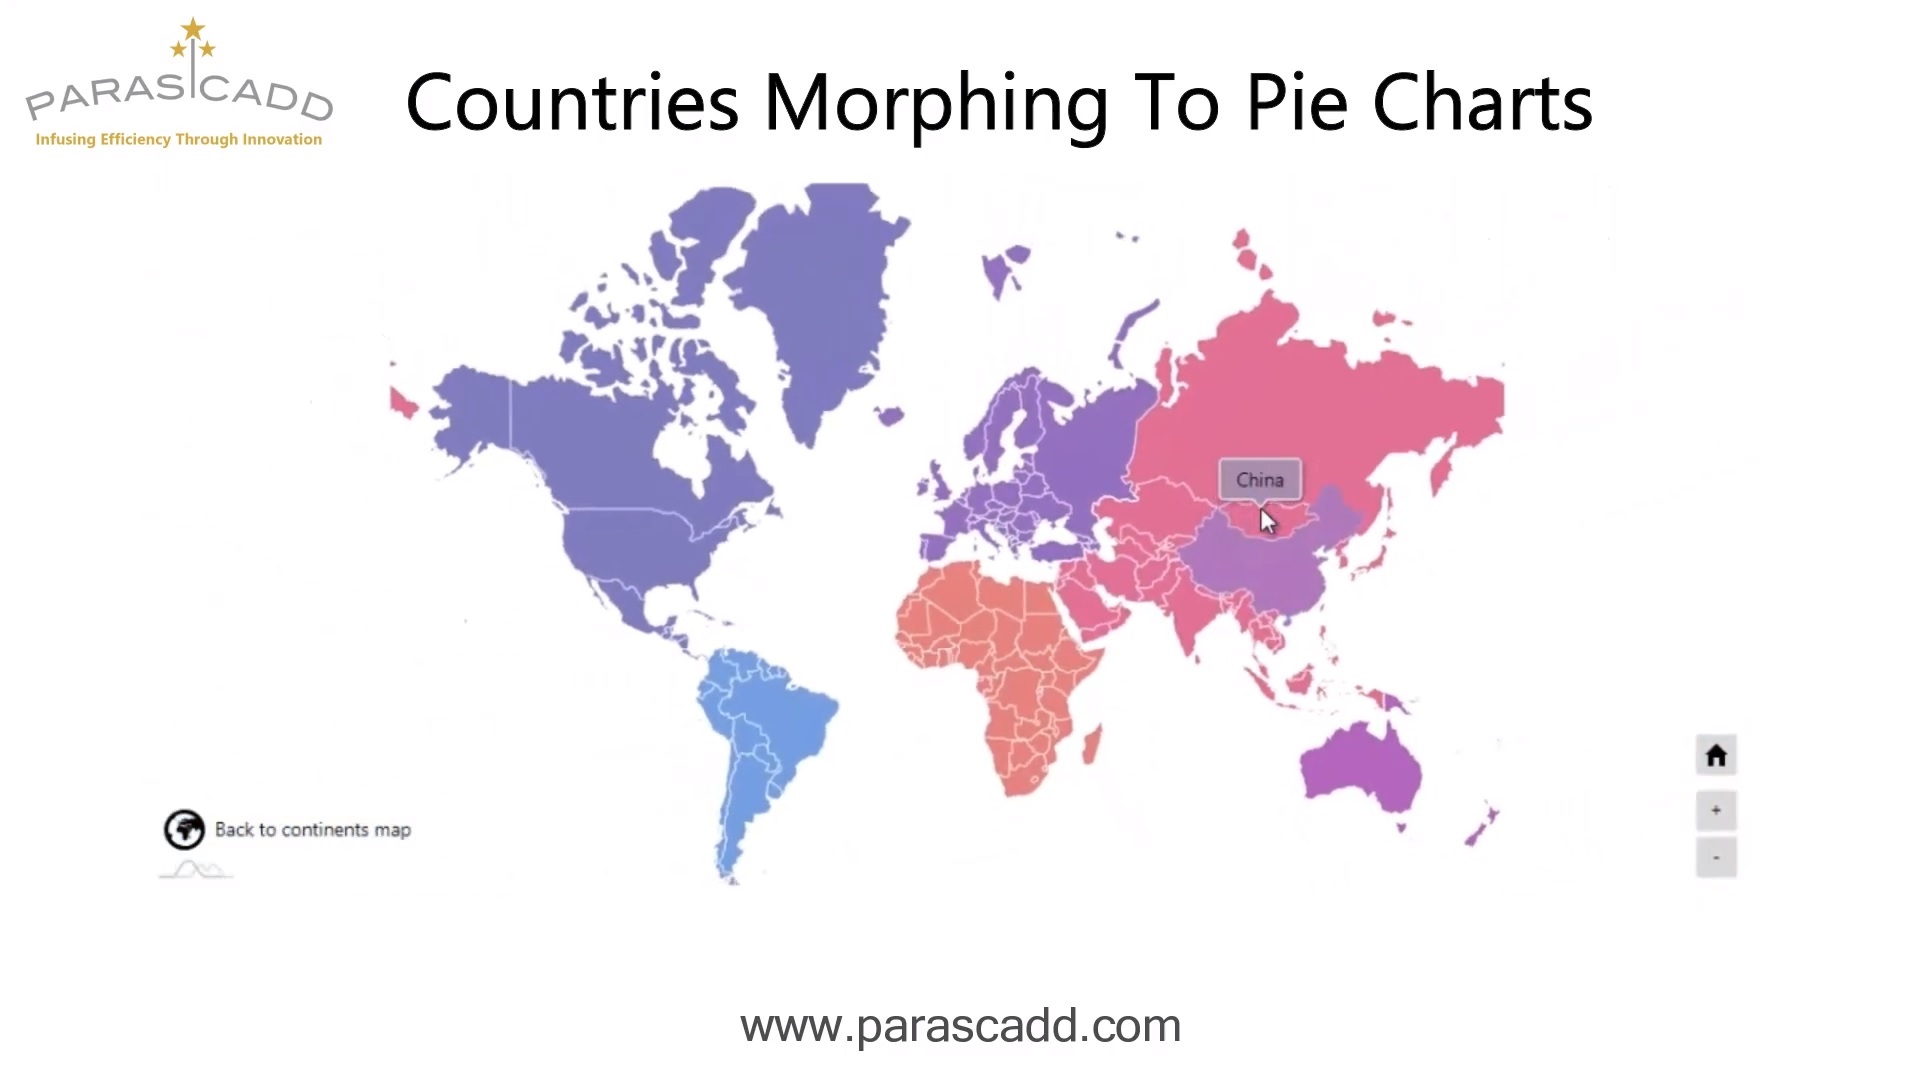
These parameters are graphically represented through colorful appealing Charts, Curves. We have also provided with features such as Drill down, slice & dice. Projects can be monitored Sector-wise, Client-wise, Location-wise using GPS features on the maps.
APEXMIS provides Analyzed Data in readymade results, represented in graphical form. This data is dynamically rendered.
APEXMIS – Popular Dashboard Charts